This section introduces the datasets we use in this project and briefly explains the cleaning process.
1. COIVD-19 Test Data
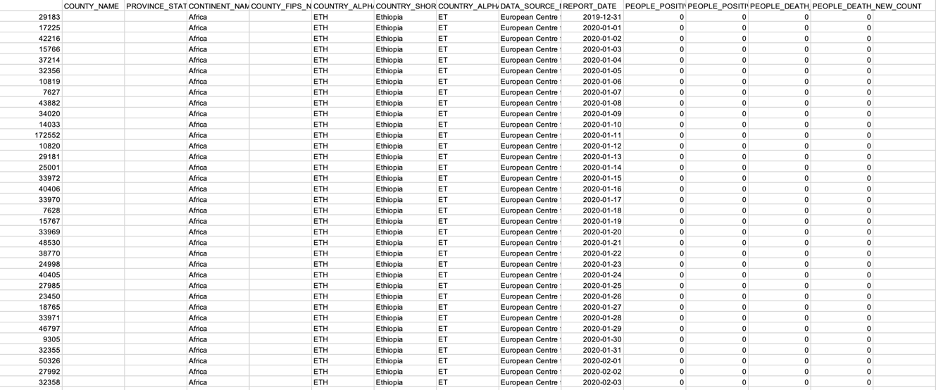
The raw data
This dataset shows the numbers of people tested positive and died daily from December 31, 2019, to September 08, 2020. Since the raw data look nice and clean already, we will use Tableau to directly draw the plots.
2. Government Measures Dataset
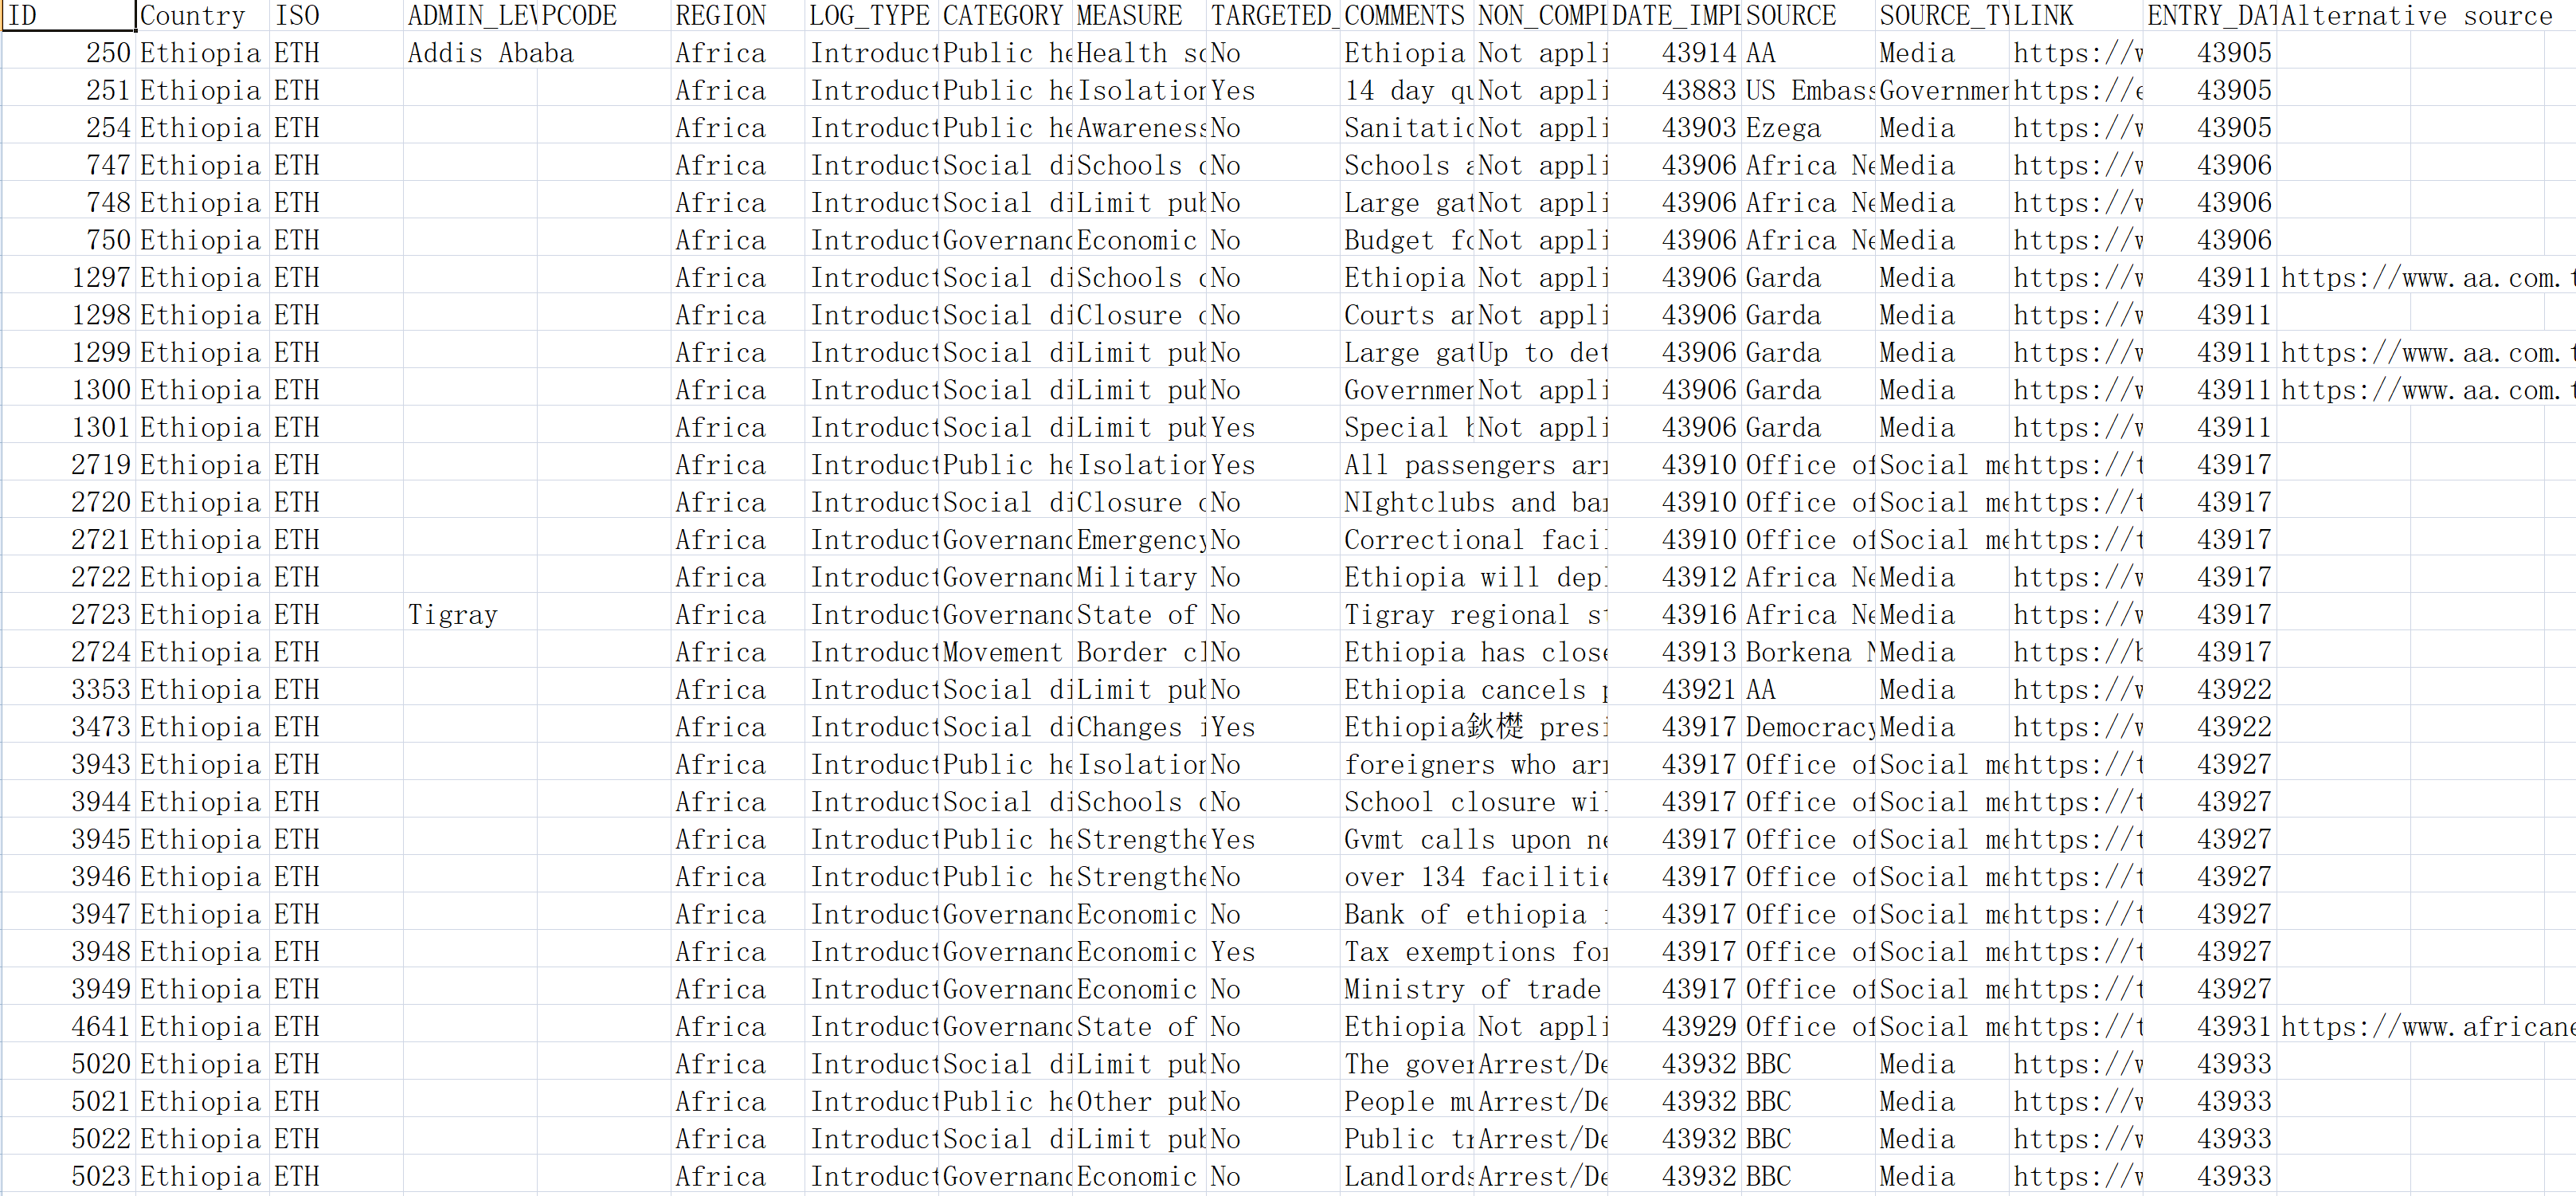
The raw data
This dataset is about the measures the Ethiopia government took to deal with the Covid-19. We removed useless variables and missing values.
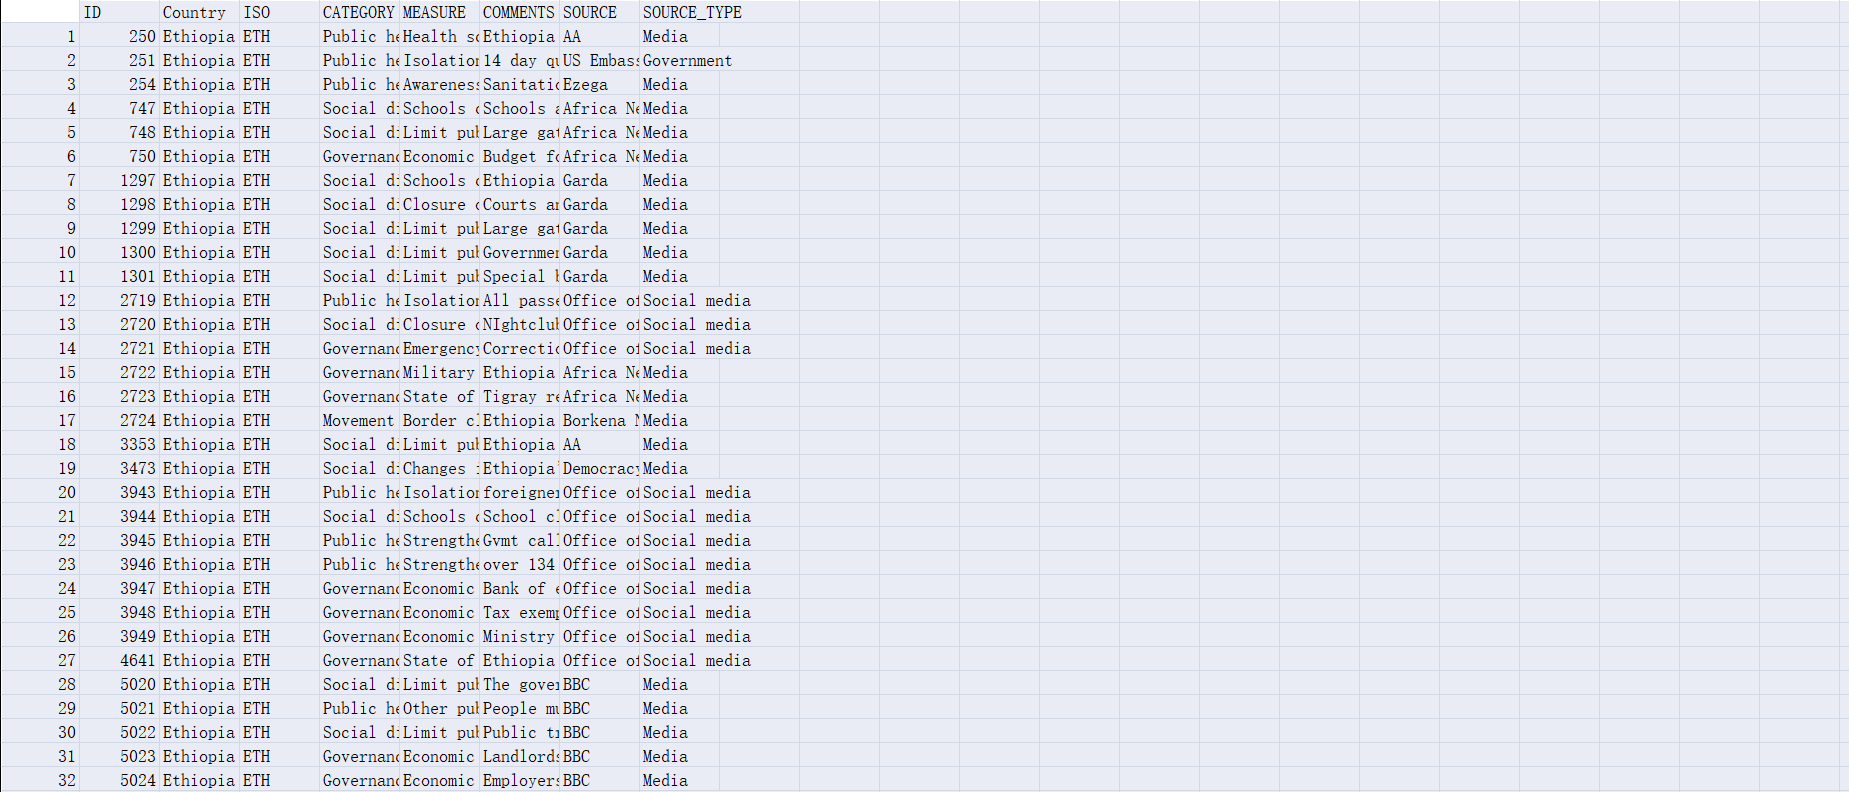
The data after clean
3. Economy and Food Data
This dataset contains data about the Ethiopian Economy, Food Quality, and Food Production from the World Bank, FAO, and the UN from 2012 to 2019.
After noticing some blanks in the original dataset provided, we used FAO, UN, and World Bank data from Kaggle to fill out the blanks. However, some variables like natural disasters (wind, sea-level, etc.) have no substitute data. In that case, we introduced a new variable, “natural disaster (or disease) disbursement” to replace the occurrence of each disaster. The table below is the cleaned dataset.
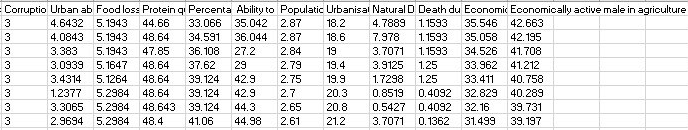
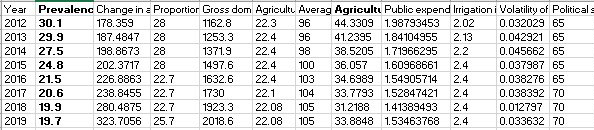
The data after clean
Furthermore, we set "Prevalence of undernourishment population" as the dependent variable, which measures the proportion of undernourishment population among the total population each year (2012-2019) based on global undernourishment criteria.
4. Exposure Risk Score of COVID-19 by District and Region Data
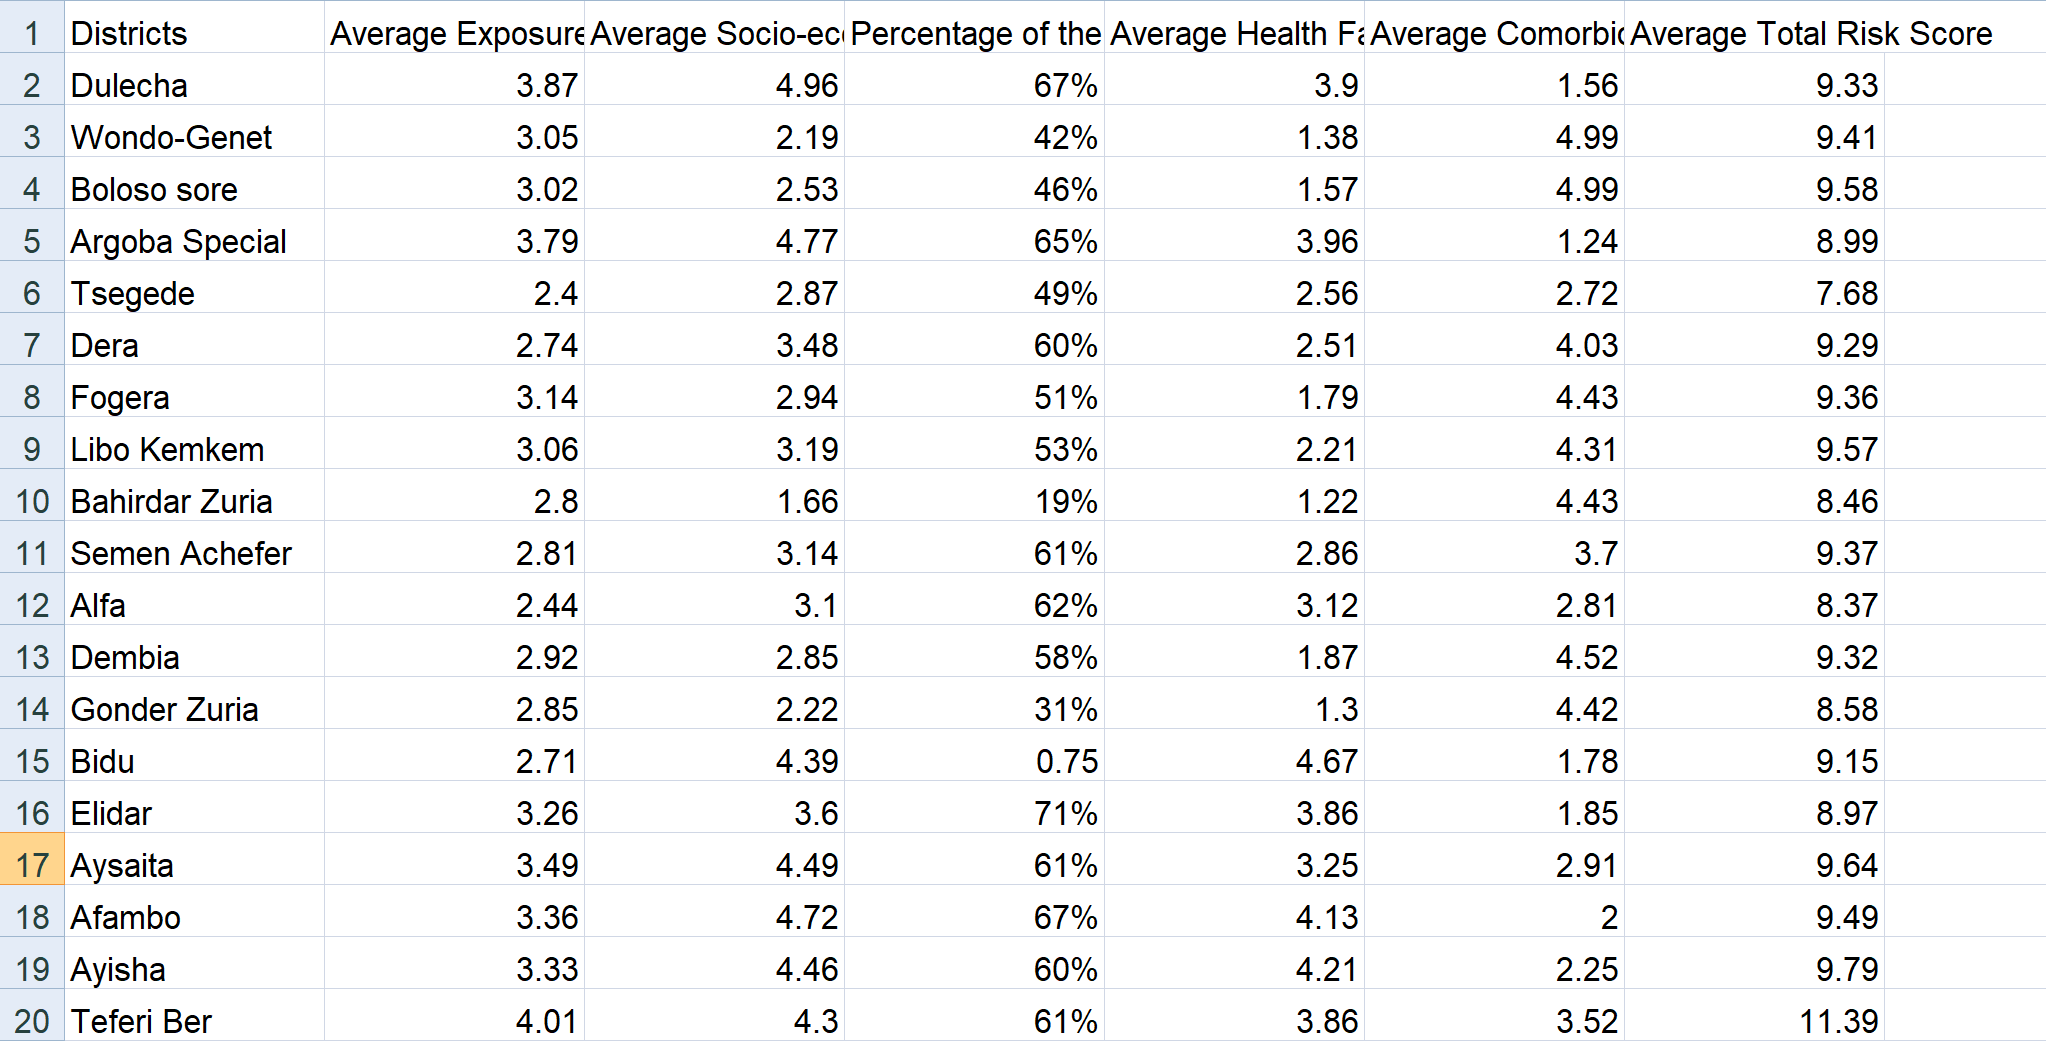
Risk score by district
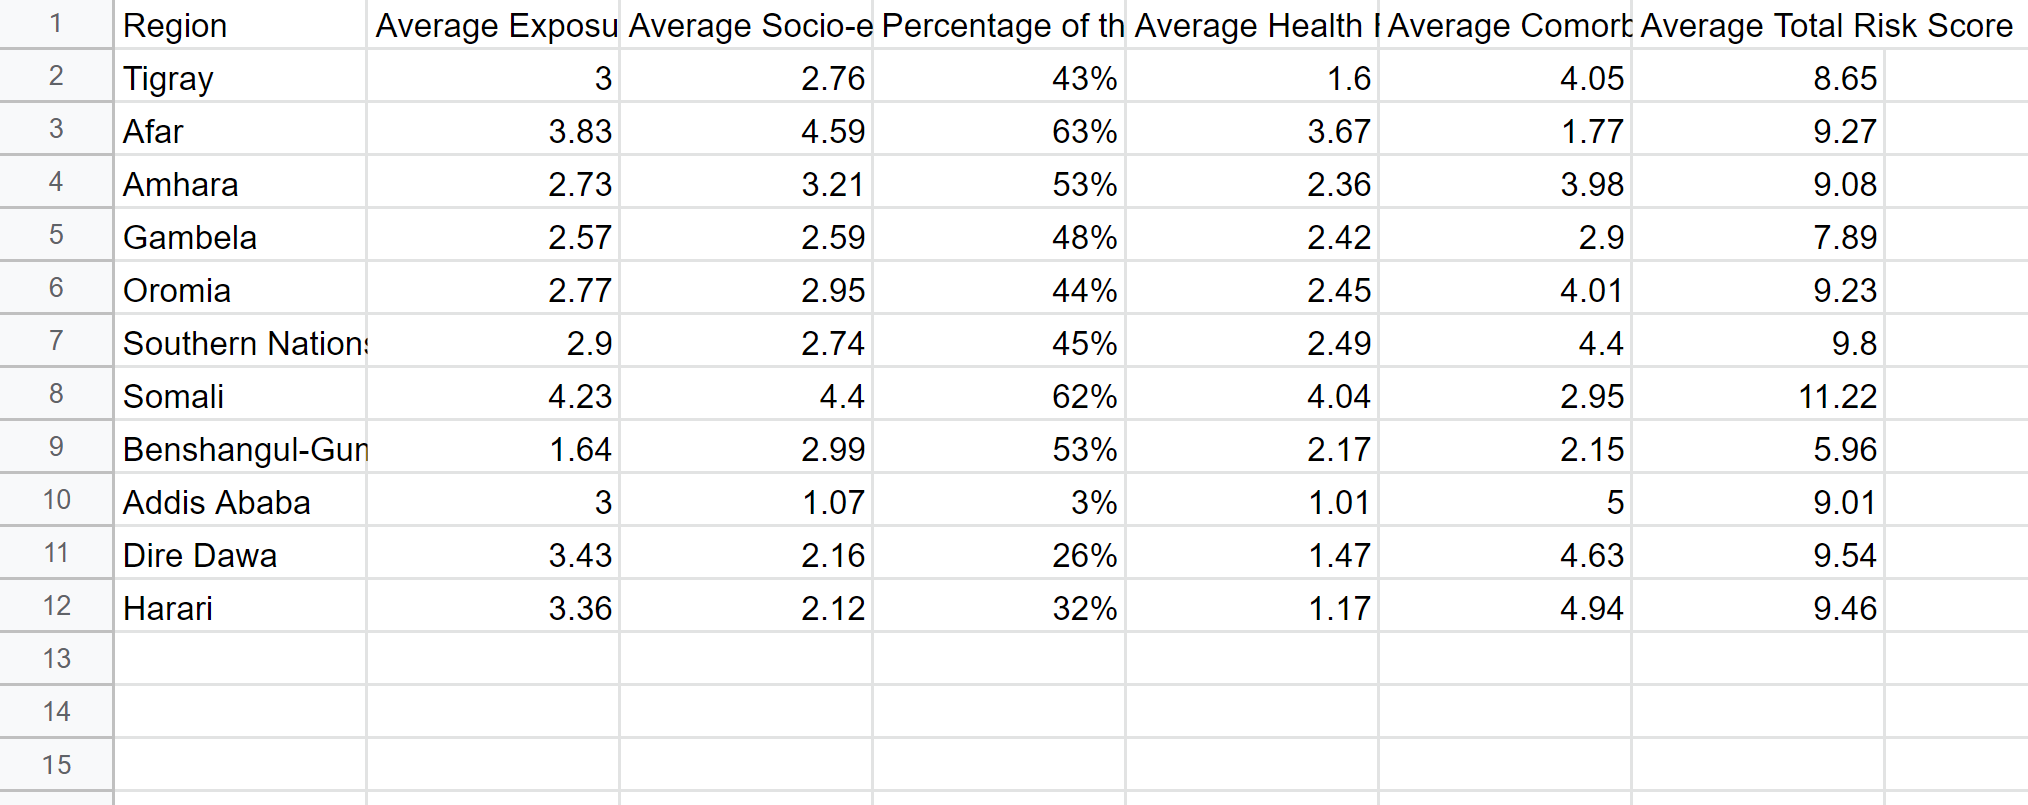
Risk score by region
These data are the exposure risk scores of COVID-19 by district and region in Ethiopia. It takes many perspectives into accounts, such as the household level, food security, health facility accessibility, and more. Each column's scale is from 1 to 5; the scale of the average total risk score is from 3 to 15; a higher score represents a higher risk of being exposed to COVID-19.